In this series, we will cover often ignored aspect of Android app development, Memory Leaks
What is memory leak?
Android is managed memory environment, As a developer you don’t need to take care of allocating, deallocating memory yourself, Garbage Collector takes care of freeing up objects that are no longer needed. But GC can’t free up objects which are still getting referenced, it results in precious memory not getting freed. This non freed objects are called leaks.
How to find memory leaks
This is not a trivial problem to solve :(, what you can’t see with your eyes, is something you won’t be able to find easily.
Hard Way
Using MAT(Memory analyser tool) we can do this, it requires lots of steps and patience.
- Take heap dump using DDMS hprof dump.
- Convert in to format which MAT can understand
- Open converted dump in MAT
- Analyse denominator tree,leak suspects to find out root cause of leaks.
The Eclipse Memory Analyzer is a fast and feature-rich Java heap analyzer that helps you find memory leaks and reduce memory consumption.
Use the Memory Analyzer to analyze productive heap dumps with hundreds of millions of objects, quickly calculate the retained sizes of objects, see who is preventing the Garbage Collector from collecting objects, run a report to automatically extract leak suspects.
Easy way
Use Leakcanary, awesome library from square is here to rescue you.
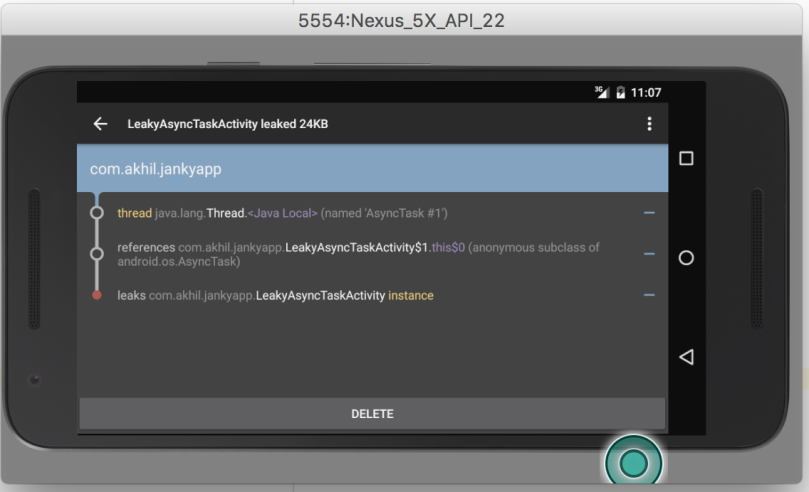
Setup instructions can be found here
We will cover common mistakes with examples & how to fix them in future posts.

[…] This post is part continuation of Memory Leaks in Android […]
LikeLike
[…] This post is part continuation of Memory Leaks in Android […]
LikeLike
[…] This post is part continuation of Memory Leaks in Android […]
LikeLike